

Major Financial Data
*The THK Group decided to adopt IFRS beginning with the 2019 fiscal year.
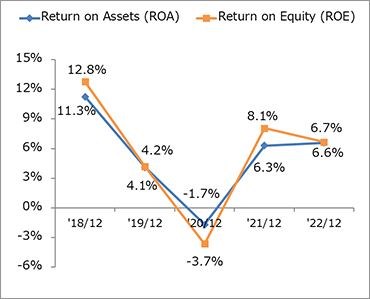
ROA, ROE
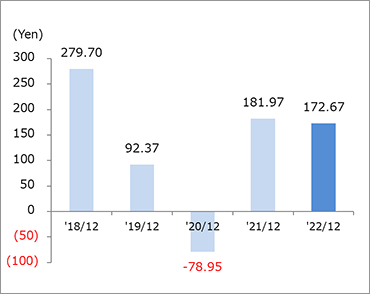
Earnings per Share
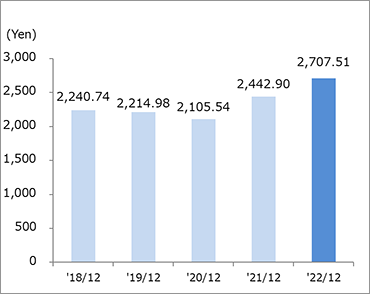
Book-value per Share
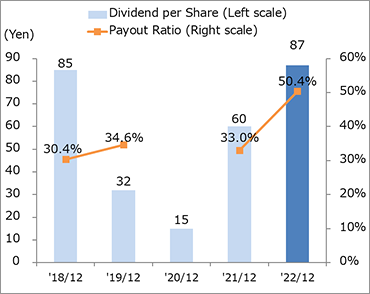
Dividend per Share, Payout Ratio
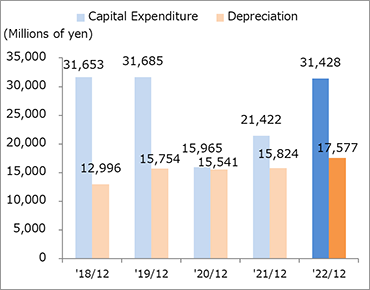
Capital Expenditure, Depreciation
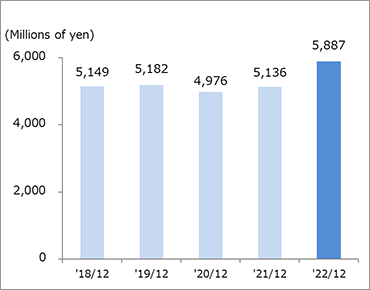
R&D Expenses
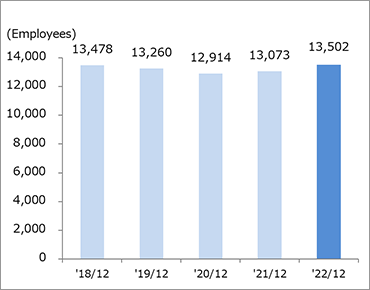
Number of Employees at End of Periods
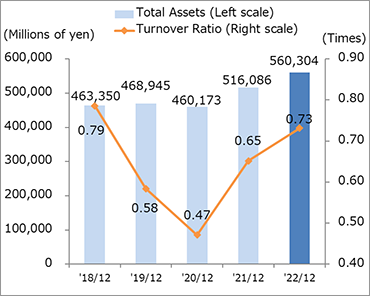
Total Assets, Turnover Ratio
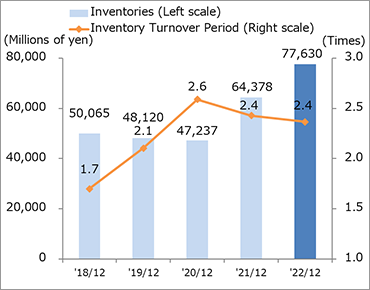
Inventory, Inventory Turnover Period (Months)
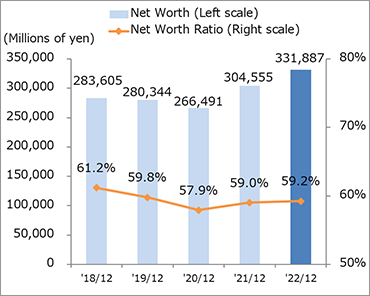
Net Worth Ratio
Millions of yen,Yen,Employees
| '18/12 | '19/12 (IFRS) |
'20/12 (IFRS) |
'21/12 (IFRS) |
'22/12 (IFRS) |
|
|---|---|---|---|---|---|
| Return on Assets (ROA) | 11.3% | 4.1% | △ 1.7% | 6.3% | 6.6% |
| Return on Equity (ROE) | 12.8% | 4.2% | △ 3.7% | 8.1% | 6.7% |
| Earnings per Share | 279.70 | 92.37 | △ 78.95 | 181.97 | 172.67 |
| Book-value per Share | 2,240.74 | 2,214.98 | 2,105.54 | 2,442.90 | 2,707.51 |
| Dividend per Share | 85 | 32 | 15 | 60 | 87 |
| Payout Ratio | 30.4% | 34.6% | - | 33.0% | 50.4% |
| Capital Expenditure | 31,653 | 31,685 | 15,965 | 21,422 | 31,428 |
| Depreciation | 12,996 | 15,754 | 15,541 | 15,824 | 17,577 |
| R&D Expenses | 5,149 | 5,182 | 4,976 | 5,136 | 5,887 |
| Number of Employees at End of Periods | 13,478 | 13,260 | 12,914 | 13,073 | 13,502 |
| Turnover Ratio | 0.79 | 0.58 | 0.47 | 0.65 | 0.73 |
| Inventory Turnover Period (Months) | 1.7 | 2.1 | 2.6 | 2.4 | 2.4 |
| Net Worth Ratio | 61.2% | 59.8% | 57.9% | 59.0% | 59.2% |