

Performance Overview
*The THK Group decided to adopt IFRS beginning with the 2019 fiscal year.
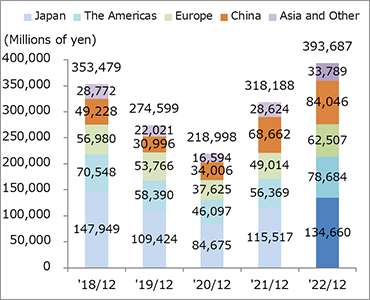
Breakdown of Consolidated Net Sales
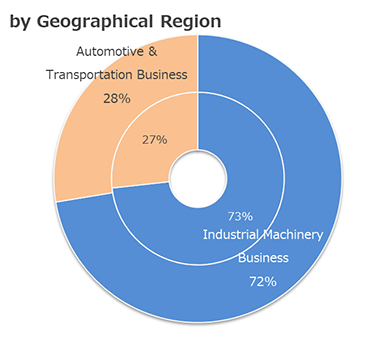
Consolidated Net Sales
- Inside: FY2021 318.1 billion yen
- Outside: FY2022 393.6 billion yen
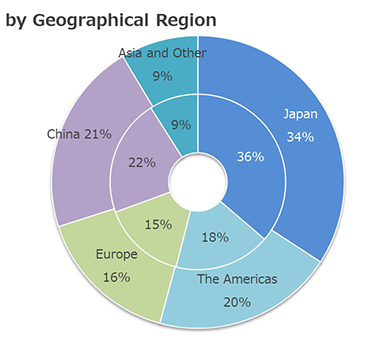
Breakdown of Unconsolidated Net Sales
Unconsolidated Net Sales
- Inside: FY2021 167.5 billion yen
- Outside: FY2022 197.6 billion yen
Consolidated Performance Overview
Millions of yen
| '18/12 | '19/12 (IFRS) |
'20/12 (IFRS) |
'21/12 (IFRS) |
'22/12 (IFRS) |
|
|---|---|---|---|---|---|
| Net Sales | 353,479 | 274,599 | 218,998 | 318,188 | 393,687 |
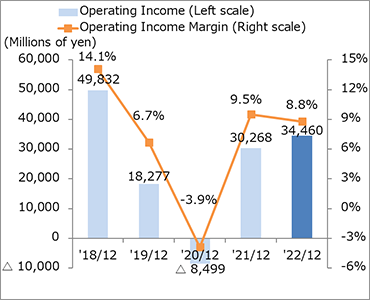
| Operating Income | 49,832 | 18,277 | △ 8,499 | 30,268 | 34,460 |
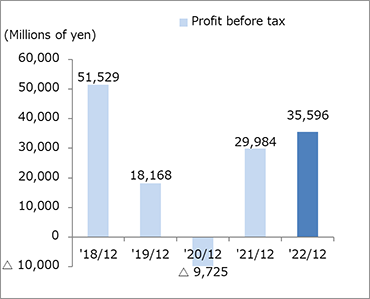
| Profit before Tax | 51,529 | 18,168 | △ 9,725 | 29,984 | 35,596 |
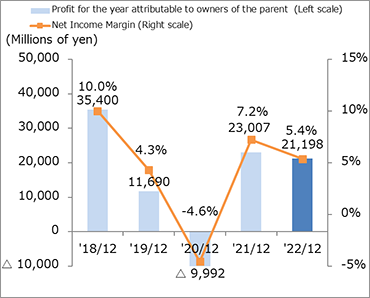
| Profit for the Year Attributable to Owners of the Parent | 35,400 | 11,690 | △ 9,992 | 23,007 | 21,198 |
| Net Assets | 294,719 | 291,132 | 275,148 | 314,289 | 337,281 |
| Total Assets | 463,350 | 468,945 | 460,173 | 516,086 | 560,304 |