

Cash Flows
*The THK Group decided to adopt IFRS beginning with the 2019 fiscal year.
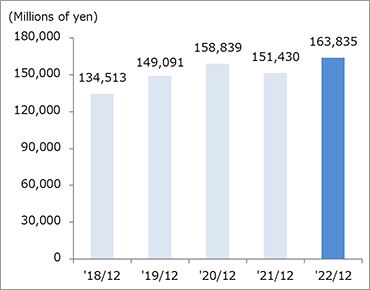
Cash and Cash Equivalents at End of Year
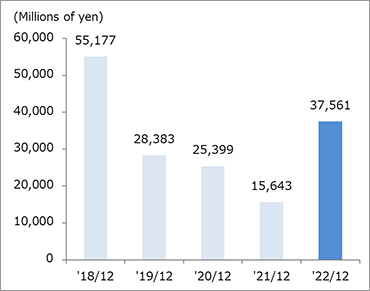
Cash Flows from Operating Activities
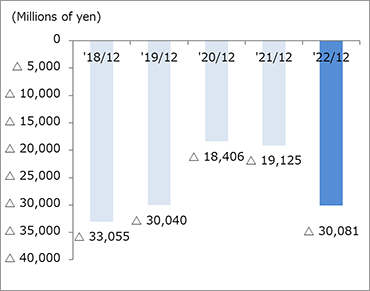
Cash Flows from Investing Activities
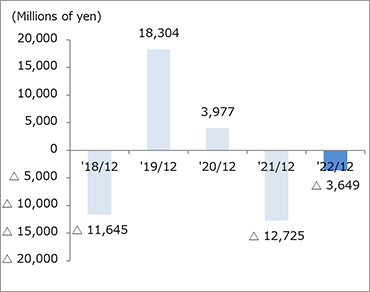
Cash Flows from Financing Activities
Millions of yen
| '18/12 | '19/12 (IFRS) |
'20/12 (IFRS) |
'21/12 (IFRS) |
'22/12 (IFRS) |
|
|---|---|---|---|---|---|
| Cash and Cash Equivalents at End of Year | 134,513 | 149,091 | 158,839 | 151,430 | 163,835 |
| Cash Flows from Operating Activities | 55,177 | 28,383 | 25,399 | 15,643 | 37,561 |
| Cash Flows from Investing Activities | △ 33,055 | △ 30,040 | △ 18,406 | △ 19,125 | △ 30,081 |
| Cash Flows from Financing Activities | △ 11,645 | 18,304 | 3,977 | △ 12,725 | △ 3,649 |